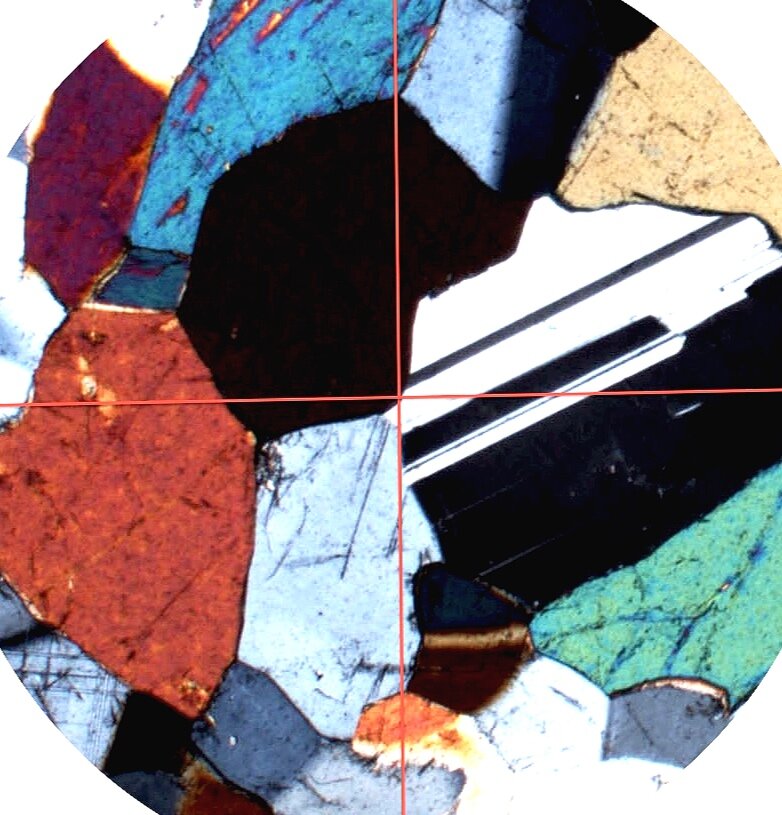
An Electron Probe Microanalyser (EPMA) combines the features of a scanning electron microscope (high magnification, high resolution imaging) with elemental analysis at the micron scale. It allows for the non-destructive analysis of very small amounts of solid materials. An electron beam is scanned across the surface of a sample and the interaction of the beam electrons with the atoms of the material examined produce a number of measurable effects. As well as producing imaging information, X-rays are generated from the sample. By measuring the energy or wavelength of these X-rays the elements present can be identified. Comparison of the intensity of X-rays produced against that of standards of known composition allows for this data to be quantified.
We use the SEM and the JEOL electron microprobe in the Advanced Analytical Centre (AAC) at James Cook University (JCU) that are equipped with:
JEOL Superprobe at the AAC
5 wavelength dispersive spectrometers (WDS), each with dual crystals
Energy dispersive spectrometer (EDS)
Tungsten (W) and LaB6 electron gun
Backscatter electron imaging (BEI)
Secondary electron imaging (SEI)
Cathodoluminescence (CL) - wavelength spectrometer system (XCLent)
High speed, high resolution, large area stage
Applications
An EPMA can be used in many areas of geology principally when chemical analyses are required on the micron scale (i.e. individual grains or small areas rather than bulk/whole sample chemistry). It is capable of elemental analysis from B to U with typical analysis volumes between 1 and 3 microns. In addition to single spot analysis, line traverses (eg for core to rim analysis of a mineral) or element maps can be produced. In the latter a grid of analysis are run and the spatial distribution of element distribution can be displayed as an image (map).
Some sample types produce visible light when excited by an electron beam; this is known as cathodoluminescence (CL). Variation in CL is often the result of changes in trace element chemistry or structural deformation/imperfections and can thus be used to distinguish between different generations of a mineral phase. The EPMA at the AAC is equipped with an XCLent wavelength spectrometer based CL system. Used in conjunction with element mapping, this can produce images illustrating the spatial distribution of CL intensity along with the variations in actual wavelengths of light being produced.
Sample requirements
Samples for EPMA need be stable under vacuum and, if not electrically conductive, carbon coated (this is done by the AAC). For quantitative analysis they need to have a flat, polished surface. A polished thin section (normal thickness) or polished mount (button) are best.


